The East Devon Community Race Series 2010
Team Results
At least five runners are required for a team to score in an individual race. The best four races score for the series (scores in parentheses have been dropped.)
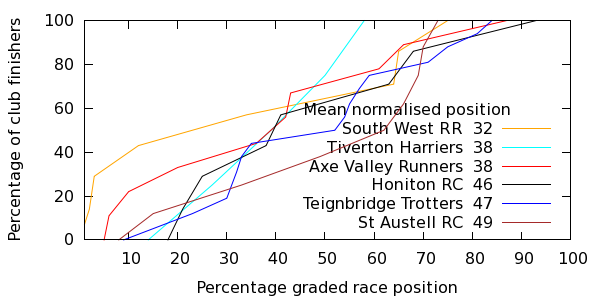
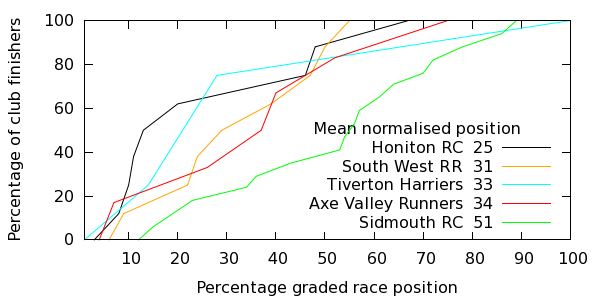
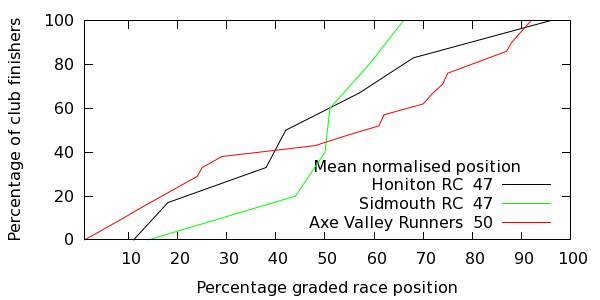
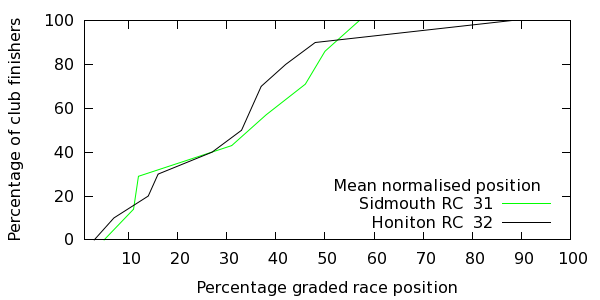
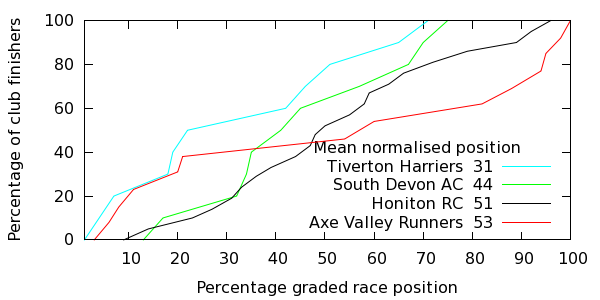
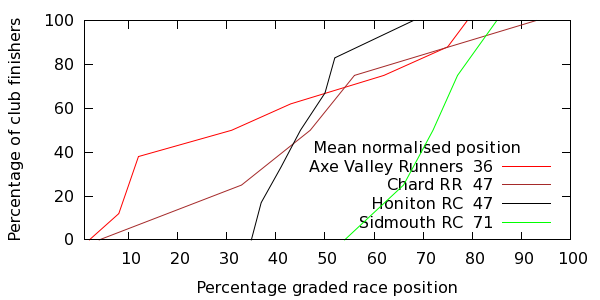
Team results are computed by arranging runners in age- and gender-graded order, computing each team's mean (average) position and then normalising this to a percentage of the number of runners in the race. Each race's results below shows a table of average position, team and number of runners, plus a graph of the cumulative percentage of finishers in each team against their normalised race position.
All teams sorted by mean position
|
|---|
| Pos | Team | Total | Mean | dal | tal | umb | far | dal | yar
|
|---|
| South West RR | 64.2 | 32.1 | 32.5 | 31.7 | | | |
|
| Tiverton Harriers | 103.1 | 34.4 | 38.0 | 33.2 | | | 31.9 |
|
| 1 | Honiton RC | 151.6 | 37.9 | 46.3 | 25.7 | (47.6) | 32.3 | (51.9) | 47.3
|
| 2 | Axe Valley Runners | 159.4 | 39.9 | 38.2 | 34.8 | 50.3 | | (53.4) | 36.1
|
| South Devon AC | 44.7 | 44.7 | | | | | 44.7 |
|
| Chard RR | 47.1 | 47.1 | | | | | | 47.1
|
| Teignbridge Trotters | 47.3 | 47.3 | 47.3 | | | | |
|
| St Austell RC | 49.8 | 49.8 | 49.8 | | | | |
|
| 3 | Sidmouth RC | 202.5 | 50.6 | | 51.7 | 47.8 | 31.7 | | 71.3
|
|
dalwood
|
| Av Pos | Team | Runners
|
|---|
| 32.5 | South West RR | 8
| | 38.0 | Tiverton Harriers | 5
| | 38.2 | Axe Valley Runners | 10
| | 46.3 | Honiton RC | 8
| | 47.3 | Teignbridge Trotters | 17
| | 49.8 | St Austell RC | 9
|
| 
|
|
talaton
|
| Av Pos | Team | Runners
|
|---|
| 25.7 | Honiton RC | 9
| | 31.7 | South West RR | 9
| | 33.2 | Tiverton Harriers | 5
| | 34.8 | Axe Valley Runners | 7
| | 51.7 | Sidmouth RC | 18
|
| 
|
|
umborne
|
| Av Pos | Team | Runners
|
|---|
| 47.6 | Honiton RC | 7
| | 47.8 | Sidmouth RC | 6
| | 50.3 | Axe Valley Runners | 22
|
| 
|
|
farway
|
| Av Pos | Team | Runners
|
|---|
| 31.7 | Sidmouth RC | 8
| | 32.3 | Honiton RC | 11
|
| 
|
|
dalwood10k
|
| Av Pos | Team | Runners
|
|---|
| 31.9 | Tiverton Harriers | 11
| | 44.7 | South Devon AC | 11
| | 51.9 | Honiton RC | 22
| | 53.4 | Axe Valley Runners | 14
|
| 
|
|
yarcombe
|
| Av Pos | Team | Runners
|
|---|
| 36.1 | Axe Valley Runners | 9
| | 47.1 | Chard RR | 5
| | 47.3 | Honiton RC | 7
| | 71.3 | Sidmouth RC | 5
|
| 
|