The East Devon Community Race Series 2011
Team Results
At least five runners are required for a team to score in an individual race. The best four races score for the series (scores in parentheses have been dropped.)
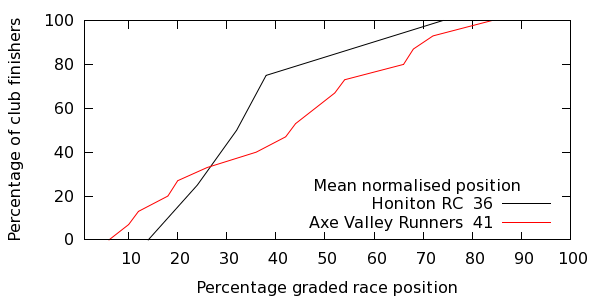
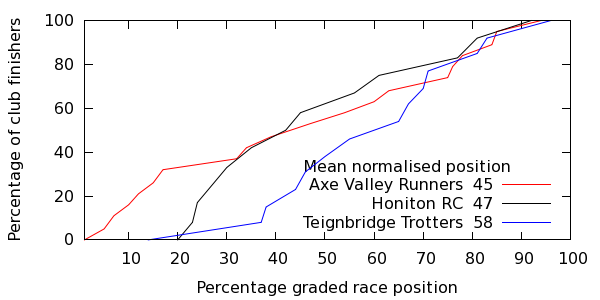
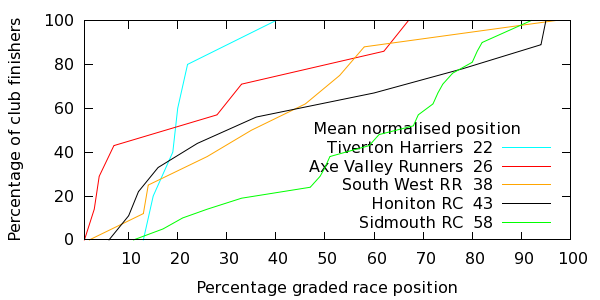
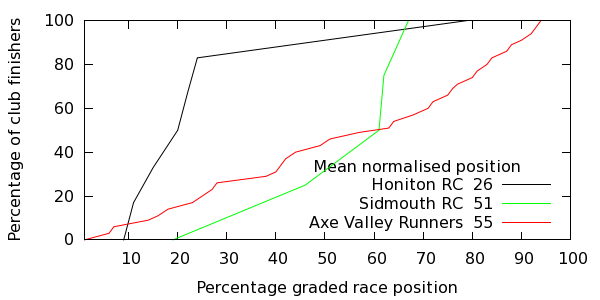
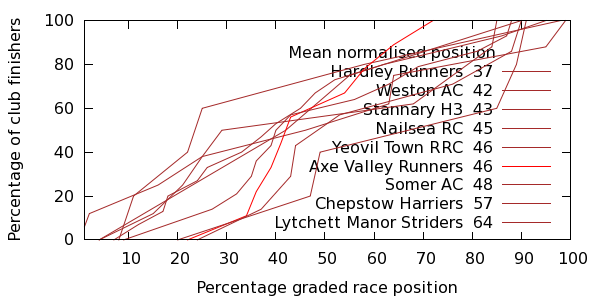
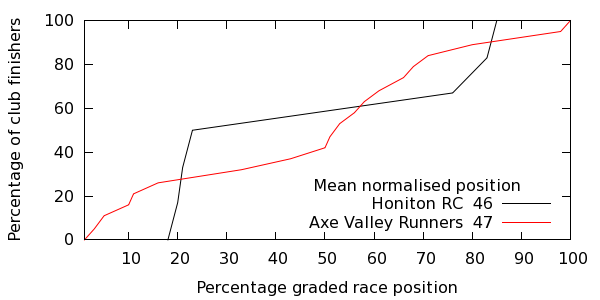
Team results are computed by arranging runners in age- and gender-graded order, computing each team's mean (average) position and then normalising this to a percentage of the number of runners in the race. Each race's results below shows a table of average position, team and number of runners, plus a graph of the cumulative percentage of finishers in each team against their normalised race position.
All teams sorted by mean position
|
|---|
| Pos | Team | Total | Mean | axm | dal | tal | umb | cha | dal | yar
|
|---|
| Tiverton Harriers | 51.7 | 25.9 | | | 22.0 | | | 29.7 |
|
| 1 | Honiton RC | 146.9 | 36.7 | 36.4 | (47.7) | 43.5 | 26.2 | | 40.8 | (46.9)
|
| Hardley Runners | 37.3 | 37.3 | | | | | 37.3 | |
|
| South West RR | 38.6 | 38.6 | | | 38.6 | | | |
|
| 2 | Axe Valley Runners | 159.3 | 39.8 | 41.1 | 45.0 | 26.3 | (55.1) | 46.9 | (56.3) | (47.1)
|
| Weston AC | 42.7 | 42.7 | | | | | 42.7 | |
|
| Stannary H3 | 43.4 | 43.4 | | | | | 43.4 | |
|
| Nailsea RC | 45.8 | 45.8 | | | | | 45.8 | |
|
| Yeovil Town RRC | 46.0 | 46.0 | | | | | 46.0 | |
|
| Somer AC | 48.6 | 48.6 | | | | | 48.6 | |
|
| Teignbridge Trotters | 101.9 | 51.0 | | 58.8 | | | | 43.1 |
|
| Sidmouth RC | 110.1 | 55.0 | | | 58.7 | 51.4 | | |
|
| Chepstow Harriers | 57.4 | 57.4 | | | | | 57.4 | |
|
| Lytchett Manor Striders | 64.0 | 64.0 | | | | | 64.0 | |
|
|
axmouth
|
| Av Pos | Team | Runners
|
|---|
| 36.4 | Honiton RC | 5
| | 41.1 | Axe Valley Runners | 16
|
| 
|
|
dalwood
|
| Av Pos | Team | Runners
|
|---|
| 45.0 | Axe Valley Runners | 20
| | 47.7 | Honiton RC | 13
| | 58.8 | Teignbridge Trotters | 14
|
| 
|
|
talaton
|
| Av Pos | Team | Runners
|
|---|
| 22.0 | Tiverton Harriers | 6
| | 26.3 | Axe Valley Runners | 8
| | 38.6 | South West RR | 9
| | 43.5 | Honiton RC | 10
| | 58.7 | Sidmouth RC | 22
|
| 
|
|
umborne
|
| Av Pos | Team | Runners
|
|---|
| 26.2 | Honiton RC | 7
| | 51.4 | Sidmouth RC | 5
| | 55.1 | Axe Valley Runners | 36
|
| 
|
|
charmouth
|
| Av Pos | Team | Runners
|
|---|
| 37.3 | Hardley Runners | 6
| | 42.7 | Weston AC | 16
| | 43.4 | Stannary H3 | 5
| | 45.8 | Nailsea RC | 9
| | 46.0 | Yeovil Town RRC | 9
| | 46.9 | Axe Valley Runners | 10
| | 48.6 | Somer AC | 15
| | 57.4 | Chepstow Harriers | 8
| | 64.0 | Lytchett Manor Striders | 6
|
| 
|
|
dalwood10k
|
| Av Pos | Team | Runners
|
|---|
| 29.7 | Tiverton Harriers | 8
| | 40.8 | Honiton RC | 13
| | 43.1 | Teignbridge Trotters | 10
| | 56.3 | Axe Valley Runners | 17
|
| 
|
|
yarcombe
|
| Av Pos | Team | Runners
|
|---|
| 46.9 | Honiton RC | 7
| | 47.1 | Axe Valley Runners | 20
|
| 
|